Data Visualization Gallery
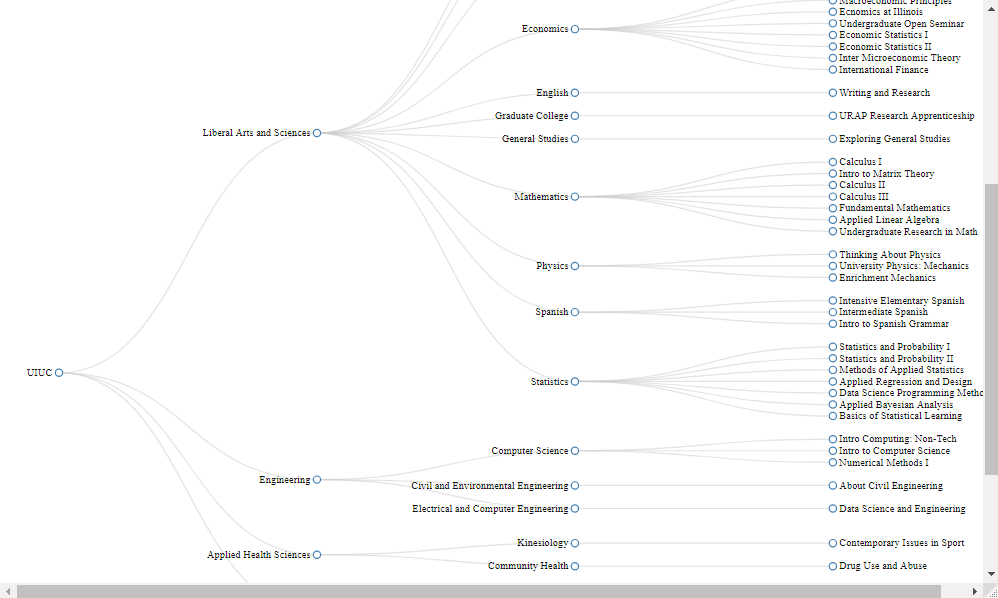
Class Network Graph
A network graph using the NetworkD3 R package showing all 46 classes I took during my 4 years of undergrad at Illinois.
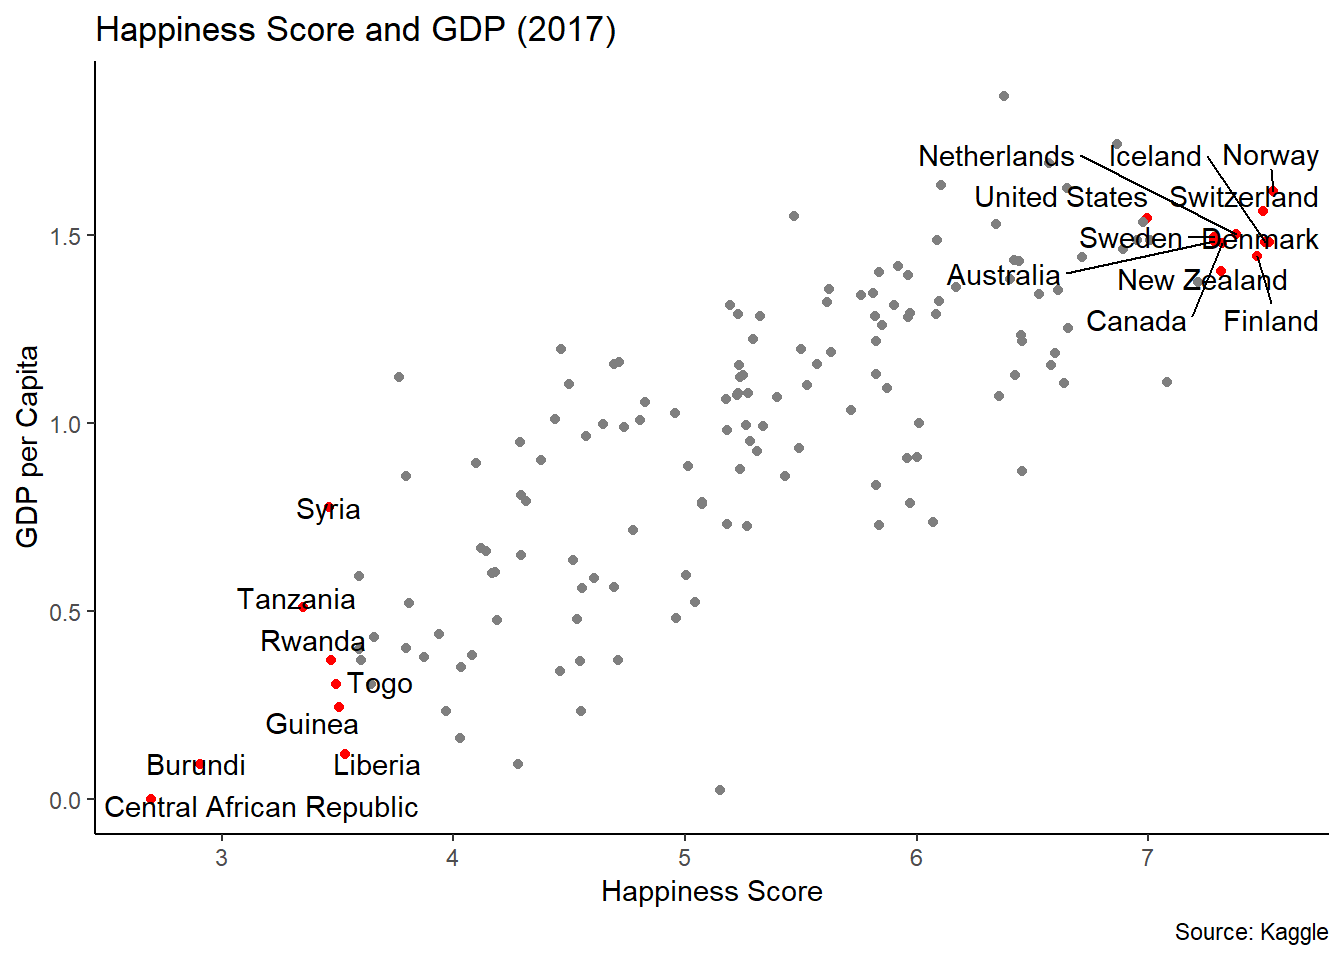
World Happiness and GDP
The top 10 and bottom 10 Happiness Rankings from the World Happiness Report (2017).

Patient Movement Tracking
A treadmill with special sensors identifies which part of a person's foot is touching the treadmill. This graph shows how a person walks over time. Red dots indicate the center of 1 stride (after 2 steps are taken).
Project Six
Lorem ipsum dolor sit amet, consectetur adipisicing elit. Fugit aliquam aperiam nulla perferendis dolor nobis numquam, rem expedita, aliquid optio, alias illum eaque. Non magni, voluptates quae, necessitatibus unde temporibus.